If time permits, we will try to put together a video this weekend showing bullish developments and concerns that remain.
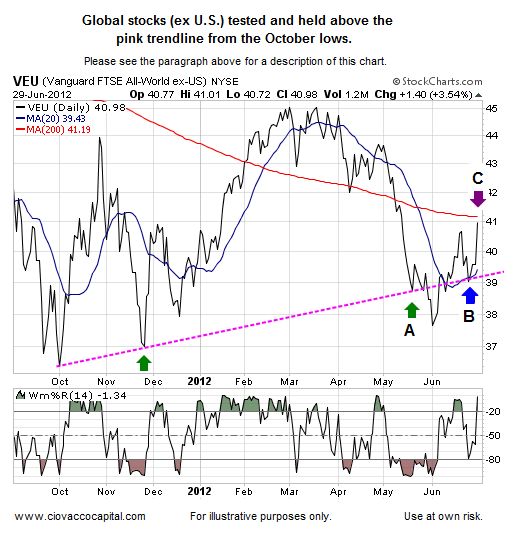
In the chart below of VEU, price is clearly above the upward-sloping trendline near point A. The 20-day moving average (blue line) held and has turned up in a bullish manner (see point B). Point C highlights a new higher high, which is indicative of an uptrend. The 200-day moving average (thin red line) is the next test for the bulls. The chart below was originally posted on June 15.
We have been talking for weeks about stocks showing signs of forming a bottom. A bottom tends to be more of a process than a one day event. On a day like today, it can be difficult to discern a climatic intermediate peak from the early stages of a prolonged move in asset prices. The weight of the evidence supports the bullish case. However, within the context of a bottoming process, stocks may need to backtrack one more time.
We began adding to our long positions on June 6. Since then, we have continued to incrementally add to the risk side of our portfolios as the markets showed improvement. We continued taking incremental steps via purchases today.
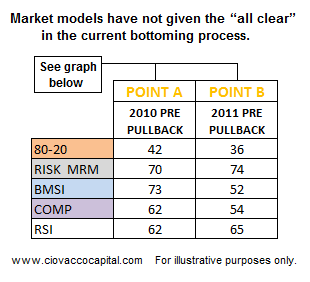
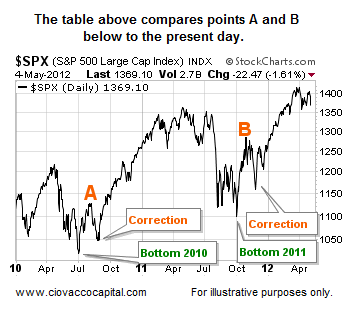
We entered Friday’s session with five core long positions and no short positions. We would have been more aggressive in terms of the percentages added, but (a) the 60-minute charts were extended, and (b) some of the thresholds in the table below have not been exceeded yet. The table was originally posted on June 21. The market may need to put another scare into everyone next week. If stocks drop, given what we know today, we would consider adding to our positions. Once the market clears the hurdles in the table below, the incremental buys can occur in larger percentage increments (or on the next pullback).
No comments:
Post a Comment