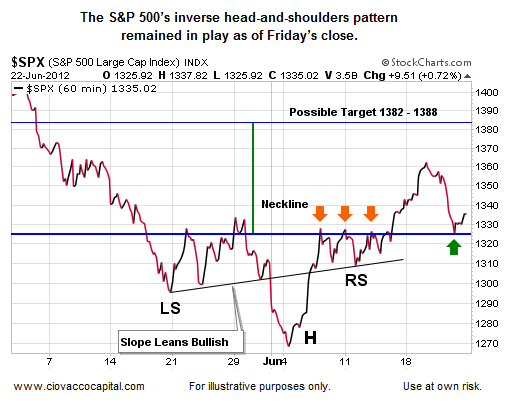
We have recently noted potentially bullish inverse head-and-shoulders patterns in other markets. The pattern is still discernible on the S&P 500’s chart below. The orange arrows below show previous resistance, which is now possible support (green arrow).

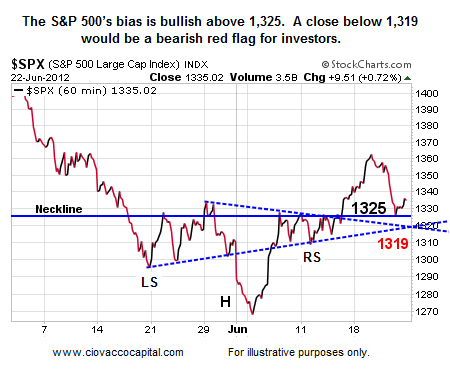
The necklines offer a good way to monitor the battle between the bulls and bears. Since the pattern becomes bearish if the neckline does not hold, we can get good information regardless of the how things unfold in the coming weeks. If the S&P 500 can hold above 1,319, an upside target of 1,388 remains possible.

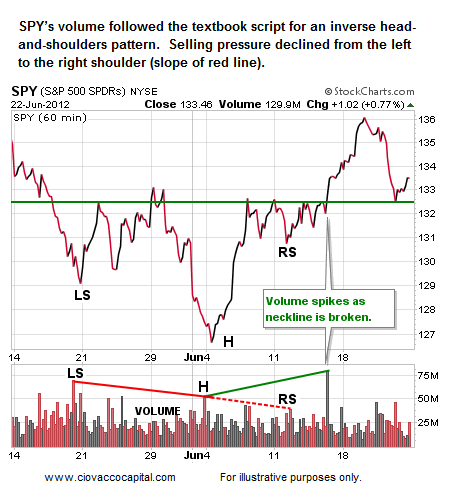
Recent volume on the S&P 500 ETF (below) fits well with a bullish inverse head-and-shoulders pattern. It is also common for a market to retest the neckline, which is what appeared to happen during Thursday’s steep decline. The neckline is in green below.

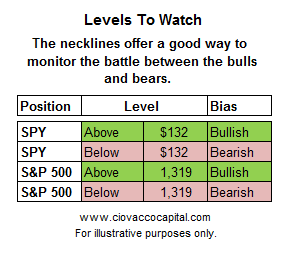
Bearish momentum could accelerate if the necklines on SPY and the S&P 500 are broken. The levels to watch are shown below.

A bearish break of a head-and-shoulders neckline needs to be respected since prices can fall rapidly. Should we see a bearish resolution to the pattern above, the June 23 video below explains why the S&P 500 may attract buyers near 1,293, 1,275, 1,265, and 1,260.


No comments:
Post a Comment